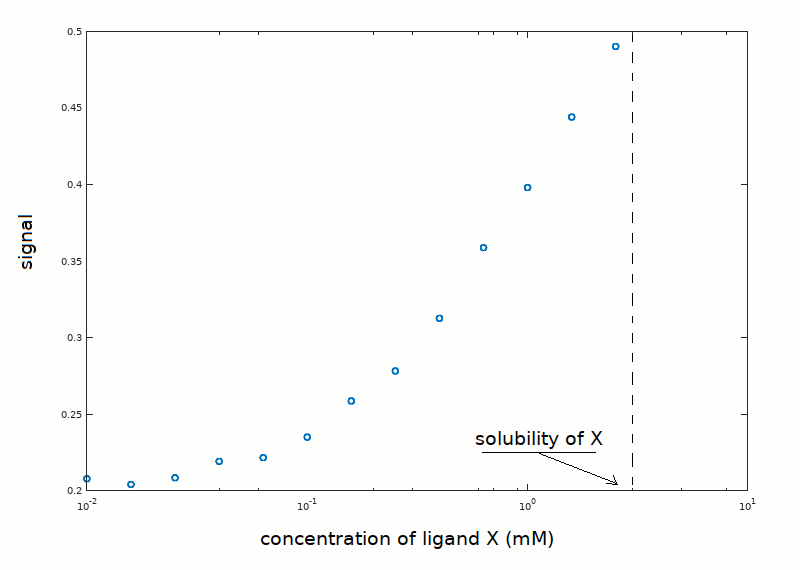
In an experiment aimed at determining the equilibrium constant of the reaction P + X <==> PX, the following data set has been collected:

Unfortunately, the low ligand's solubility prevented the use of ligand concentrations higher than those reported in the plot, thus the upper asymptote of the ligand binding isotherm was not approached. Notice that the plot reports the signal reported by the instrument used to measure ligand saturation (e.g. absorbance), rather than the fraction of liganded sites. The protein concentration was 0.05 mM, and we know from independent experiments that the protein is pure and monomeric in solution.
How would you proceed with data analysis (click to select)?
1) Fit the signal to the equation of a single site ligand binding protein and let the computer find the (theoretical) upper asymptote
2) Fit eq. Y = [X]/(K+[X]) to the experimental data in order to find the value of K that minimizes the sum of the squared residuals.
3) Linearize the data using Hill's equation log(Y/(1-Y))=nKX then draw the best straight line through the data points in order to find K and n.